Community Based Observatory Network
Strengthening Climate Response and Resilience through Innovation
Access to real-time and historical meteorological data is crucial for effective disaster response, as weather serves as the primary trigger for natural disasters. Climate change, however, adds complexity to this equation, causing erratic rainfall, prolonged droughts, flooding, and other extreme weather events in vulnerable regions. These events have far-reaching consequences, impacting food security, water availability, livelihoods, and overall well-being.
Addressing these issues is essential for building resilience in vulnerable communities. Innovative solutions are needed to digitize, store, manage, and share weather and climate-related data effectively. This will empower communities to better prepare for and respond to weather-related disasters, ultimately enhancing their capacity to adapt to a changing climate.
CBON is an innovative platform for low-cost weather and climate data collection, storage, access, and analysis, combining traditional and scientific knowledge built on 3Map.
It involves community observers who use manual weather stations, record data about weather, impacts, actions to take, traditional knowledge, and share timely information with community members and other stakeholders, enhancing localized monitoring and dissemination of weather and climate-related information.
Community involvement is essential for capturing crucial information about the impacts of weather events, incorporating indigenous knowledge and early warning practices, and documenting actions taken in response to weather-related challenges.
Additionally, it has the capability to integrate, visualize and analyze data coming from other existing sources such as automatic weather stations, remote sensing, institutional databases for more comprehensive insights.
The CBON dashboard is an open web-based platform that presents weather data from multiple sources:
Obtained data are categorized by country and location and aggregated at various time frames, including monthly, quarterly, and semesterly intervals. The data is presented through tables and graphs, with color coding indicating rainfall levels relative to the baseline. Red indicates below-average rainfall, while blue indicates above-average rainfall, facilitating comprehension.
Additionally, the data can be visualized on a map, allowing for the overlay of ground weather data from weather stations and satellite data from GPM.

CBON generates informative reports and bulletin, enabling communities to make well-informed decisions.
These reports are created using all data sources managed by CBON, including qualitative data such as text and images, which can be complex to manage. AI helps eliminate redundancy and duplication in the data while ensuring the preservation of crucial information.
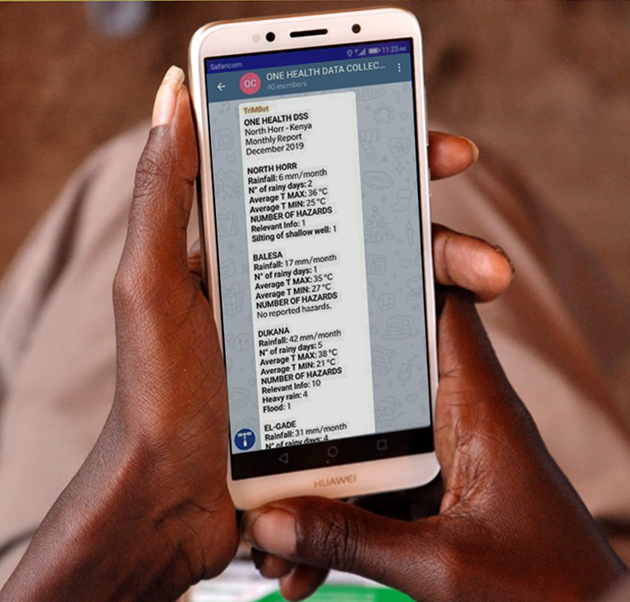
These reports are automatically generated and delivered via instant messaging applications, ensuring timely and effective dissemination of information to communities and decision makers.

CBON has a proven track record of effectiveness in multiple countries since 2019, actively aiding humanitarian efforts. It provides alerts, feedback, and data collection capabilities adaptable to evolving circumstances.
The initiative expanded to 3 countries improving agro-meteorological forecasting.